Improving User Comprehension
Replacing a dense, Excel-based loan comparison process with a digital experience that made high-stakes financial decisions easier for customers and internal teams alike.
00
problem
The bank’s existing loan comparison experience utilized excel workbooks and made it difficult for users to clearly understand loan terms, compare options, and feel confident in their decisions. Complex inputs, dense information, and unclear outputs created friction for customers at a critical point in the lending journey. The tool also needed to work for more than one audience. In addition to supporting customers directly, it had to help internal teams communicate options clearly and guide conversations more effectively. Any redesign had to simplify the experience without sacrificing accuracy, trust, or alignment with the bank’s broader lending process.
solution
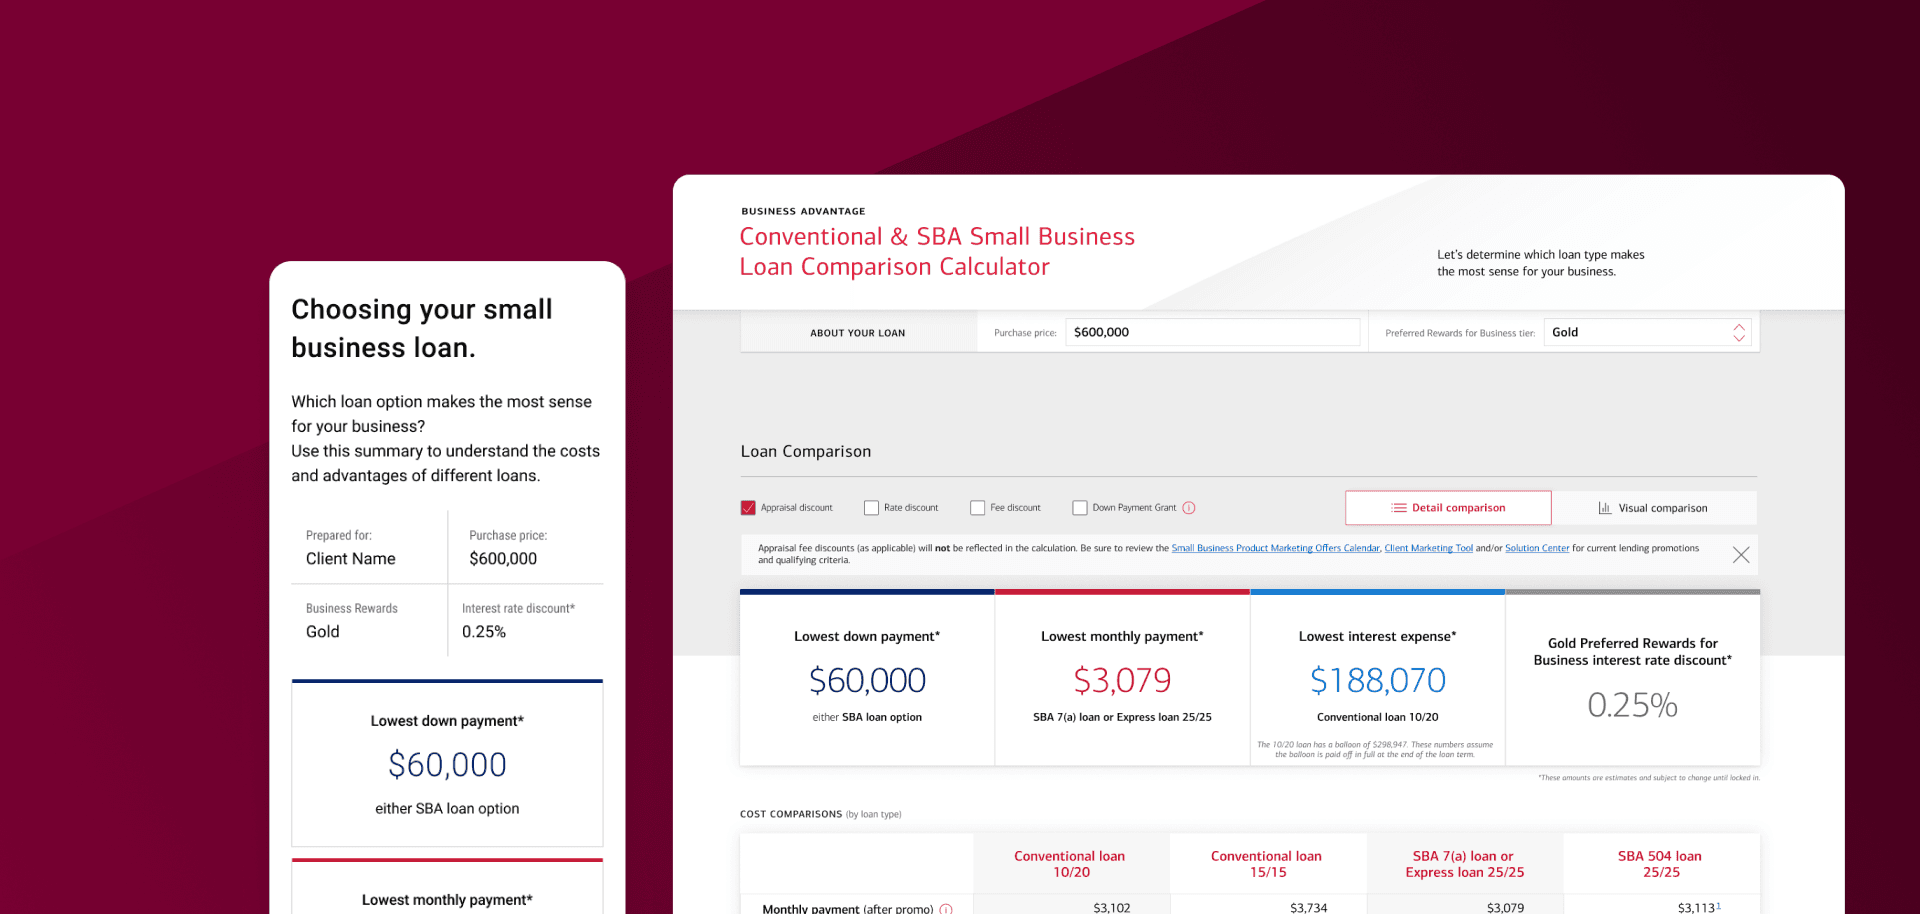
The redesign focused on making loan information easier to understand and compare by simplifying inputs, clarifying outputs, and improving the overall structure of the experience. We reduced cognitive load in the interface, making it easier for customers to evaluate financial scenarios while also giving internal teams a clearer tool to use in customer conversations. To support the broader lending journey, I also designed follow-up email outreach to re-engage users who had not yet completed the process. Together, these improvements increased usability, strengthened user confidence in financial decision-making, and contributed to higher lending conversions.
This project focused on redesigning a public-facing loan comparison tool used to help customers understand loan terms and evaluate their options. The work sat at the intersection of product clarity, financial trust, and conversion, where even small UX improvements could meaningfully influence decision-making.
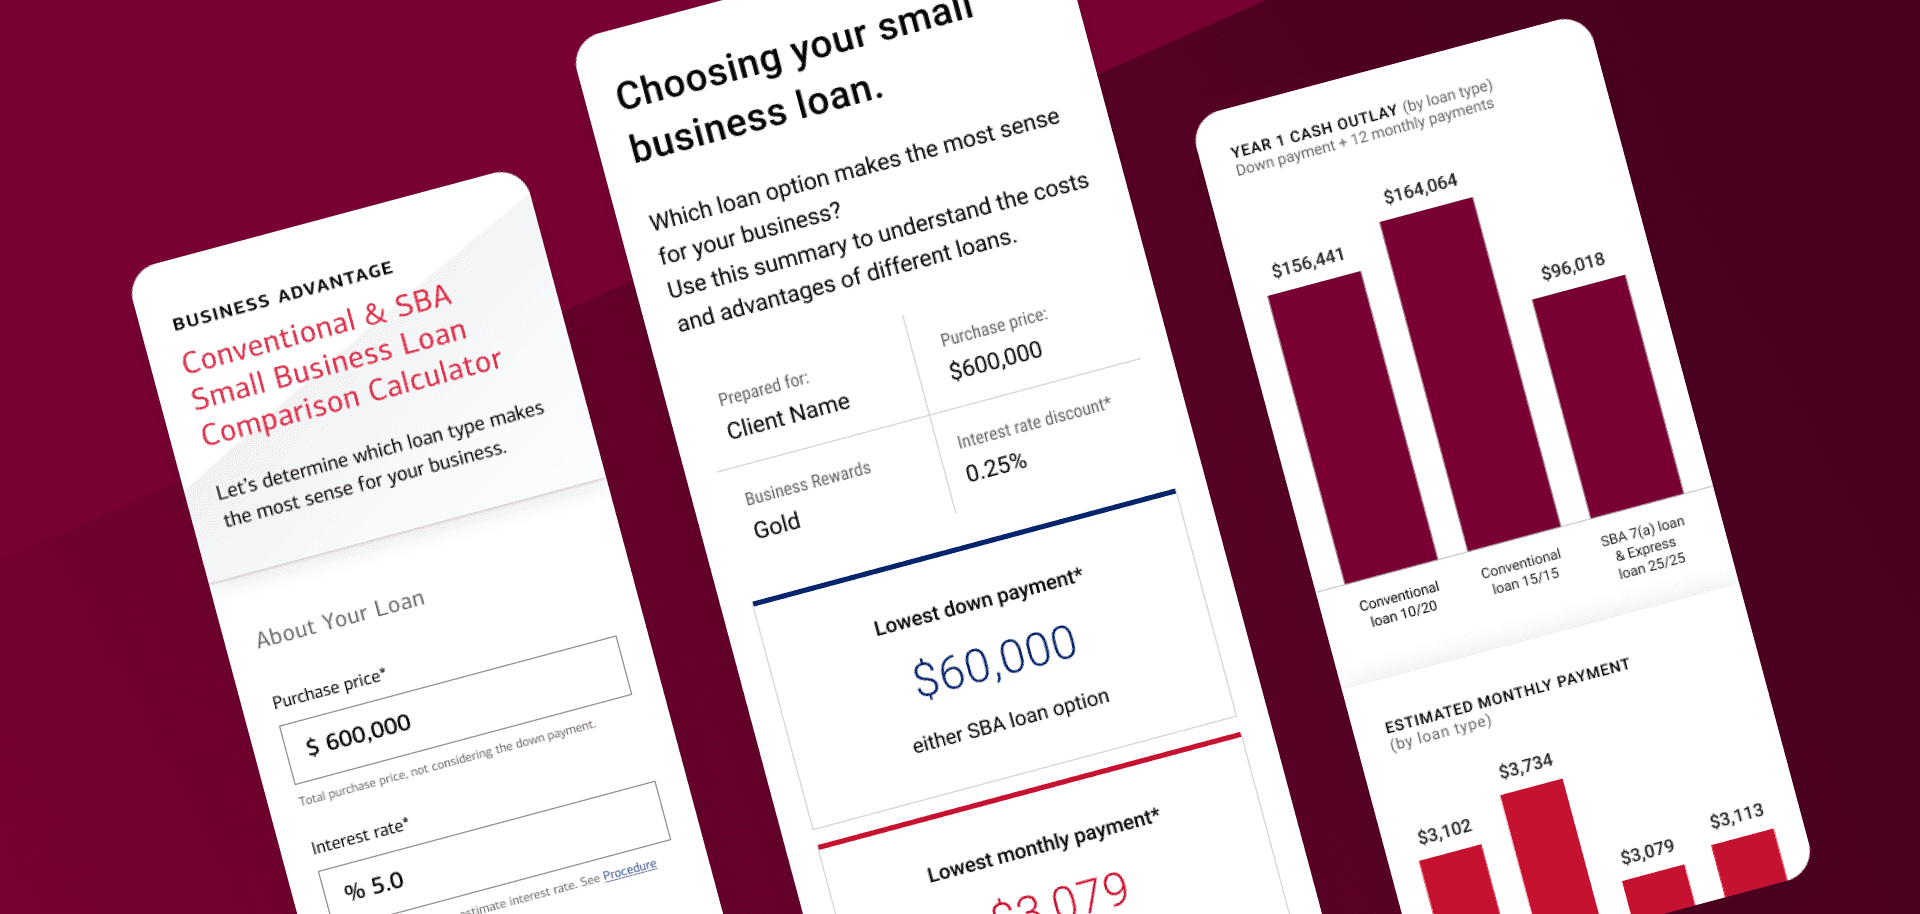
The core challenge was simplifying a financially dense experience without oversimplifying the information itself. Customers needed to compare loan scenarios with confidence, while internal employees needed a tool that supported clearer conversations and more effective guidance. The experience had to work for both audiences in a way that felt intuitive, credible, and easy to follow.
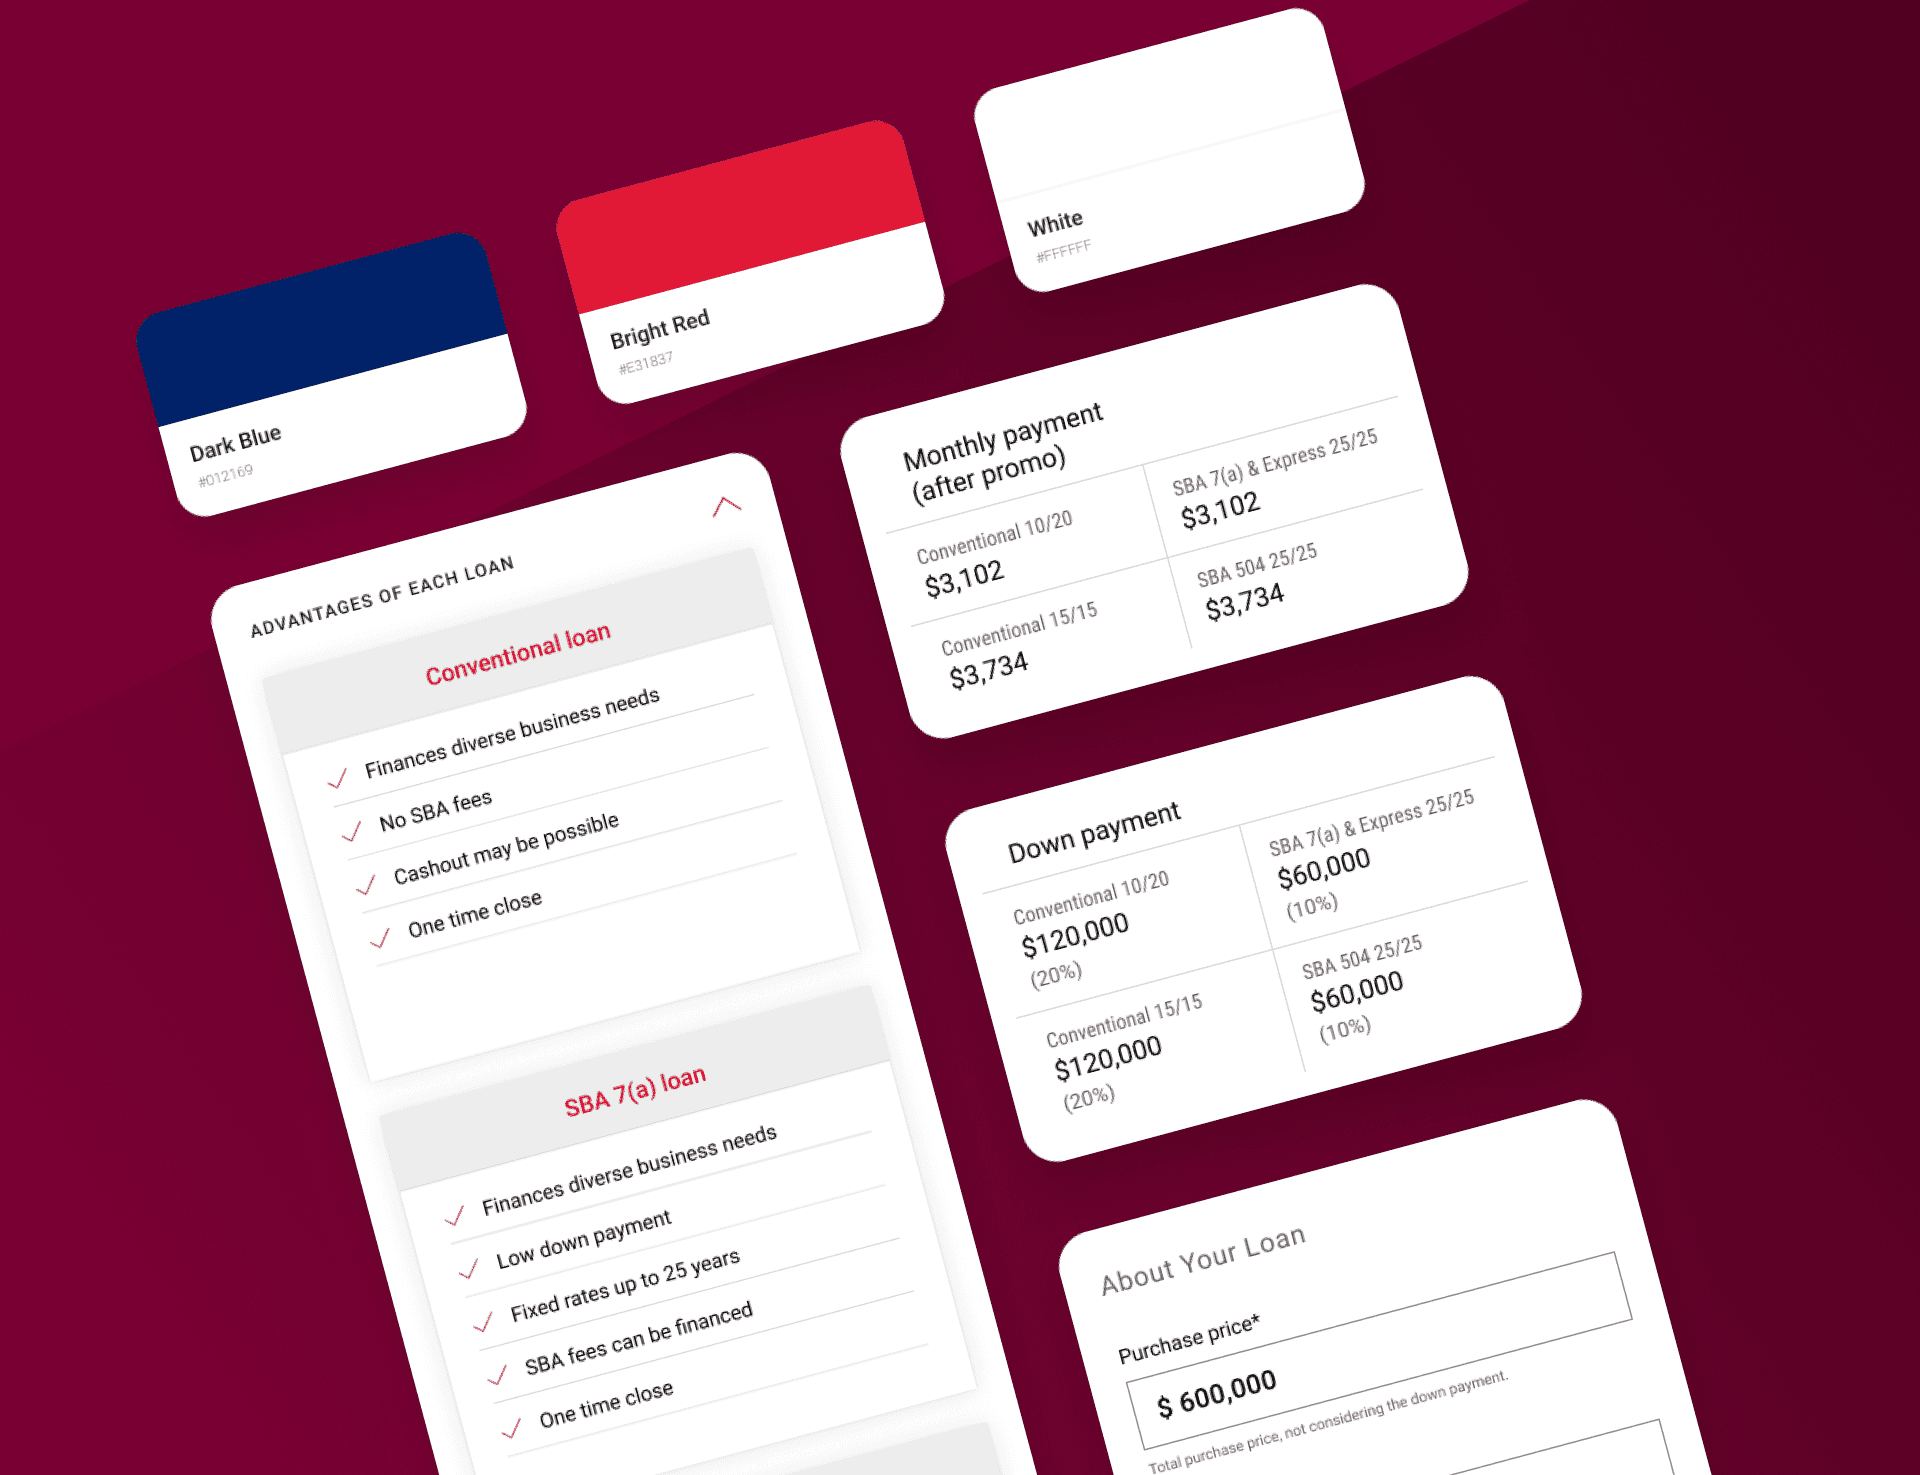
I focused on improving the structure of the tool by simplifying inputs, clarifying outputs, and making key information easier to scan and interpret. This helped reduce friction in the evaluation process and made the experience feel more approachable at a point where users often feel uncertainty. The redesign was not just about usability in isolation, but about helping people make more informed financial decisions.
Beyond the tool itself, I designed a follow-up email experience to re-engage users who had dropped off before completing the process. This helped extend the product experience beyond the interface and supported the bank’s lending funnel more holistically. The result was a clearer, more useful experience that improved customer confidence and contributed to stronger conversion performance.
Results
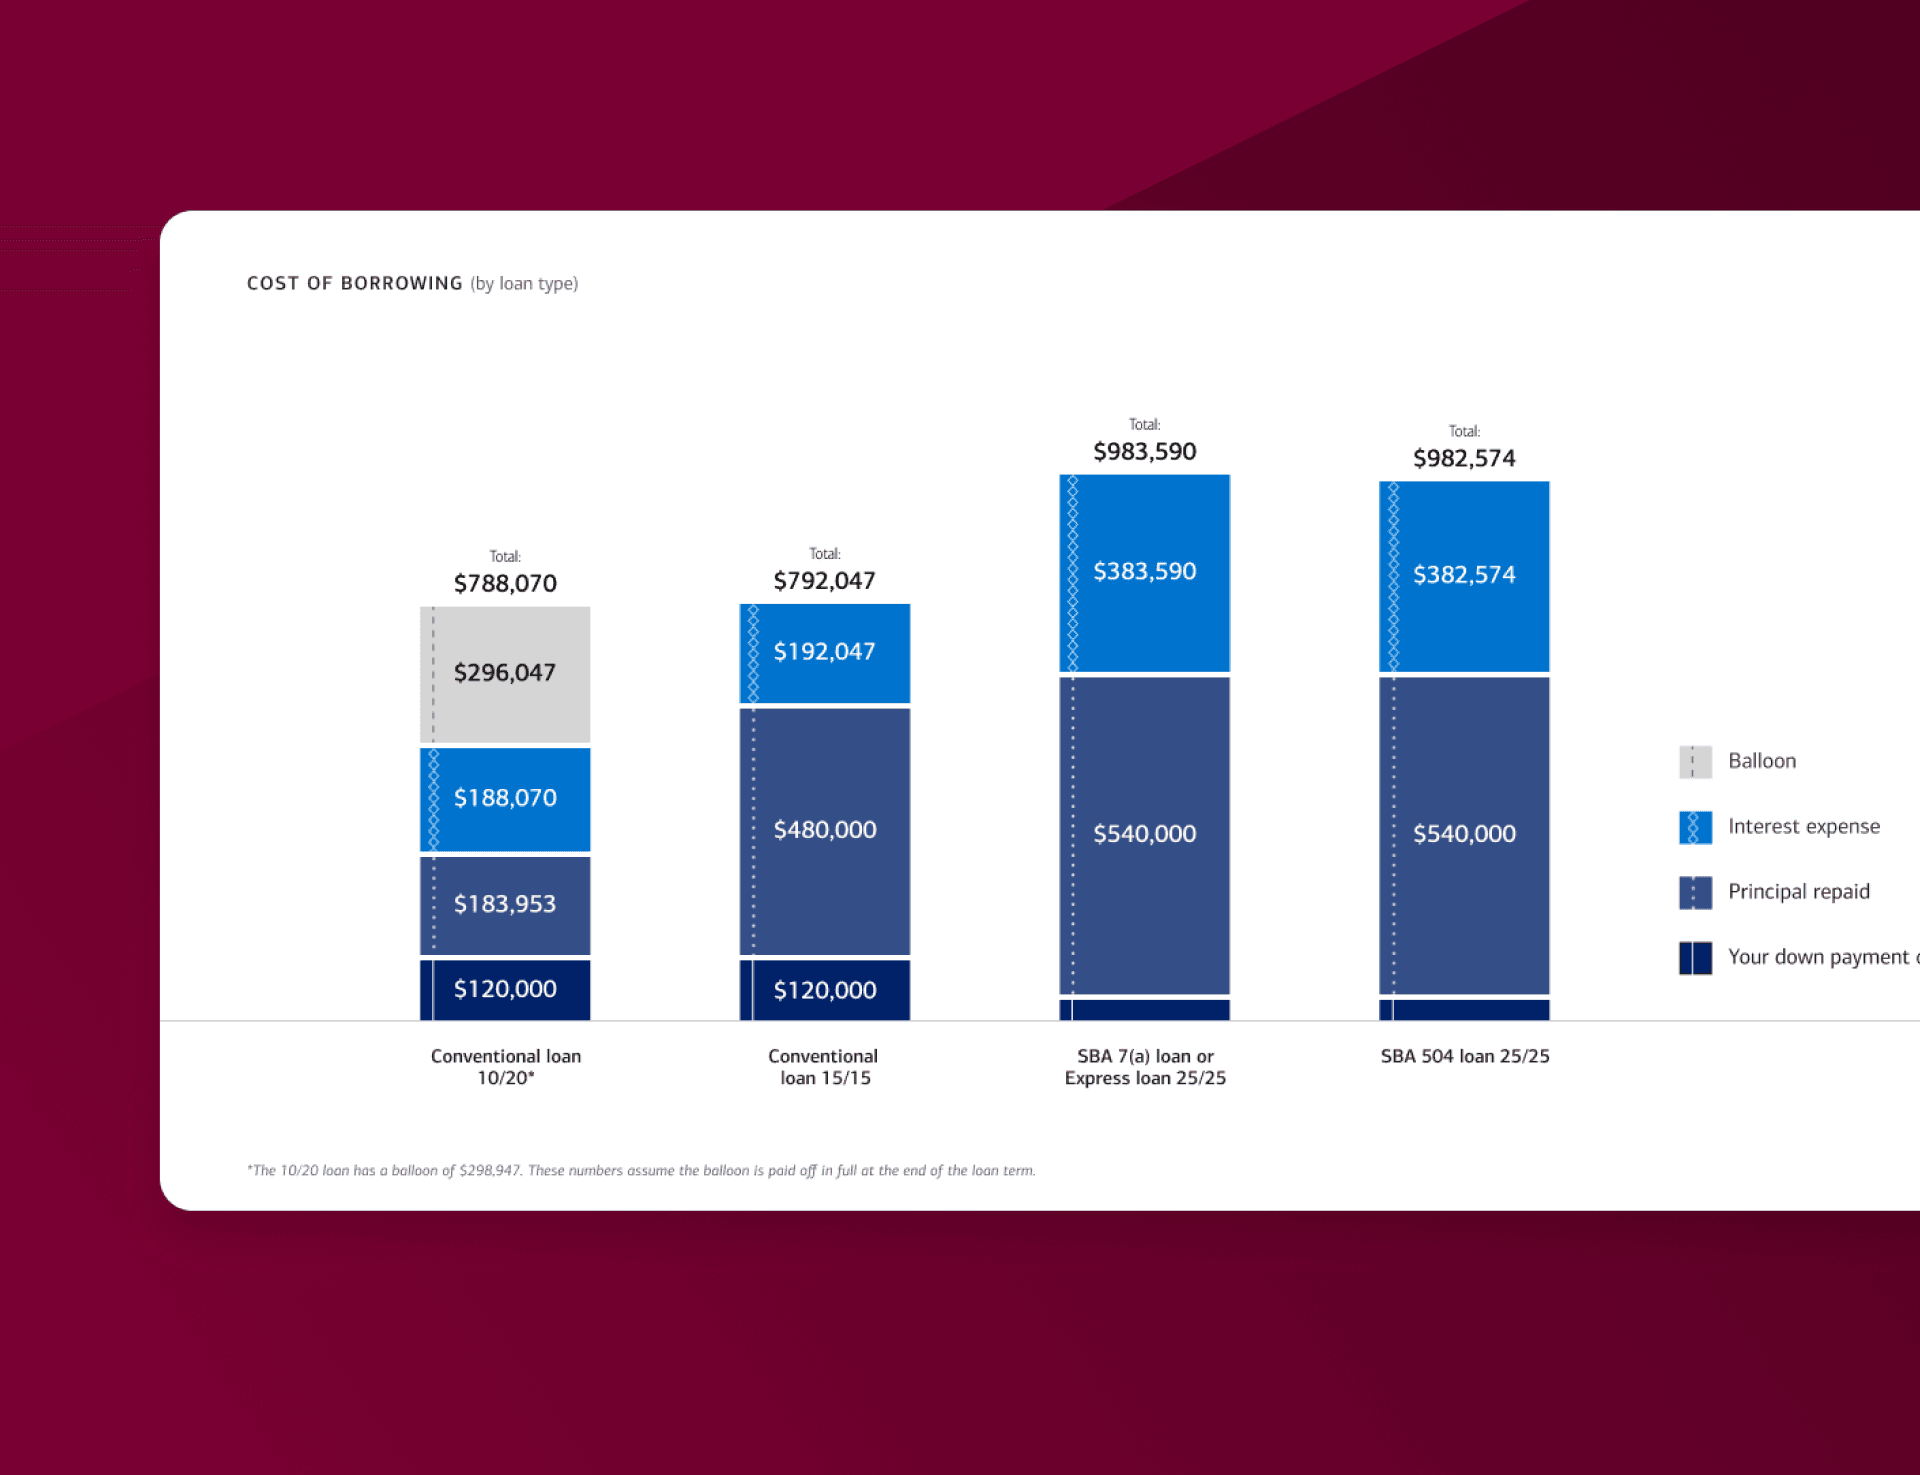
In comparative testing, users answered a set of comprehension questions +50% more accurately when using the tool than when reading traditional estimates. The redesign improved usability and user confidence at a critical decision point in the lending journey. The structured digital tool replaced a spreadsheet process that had created friction for both customers and internal teams — giving both audiences a clearer path through a complex financial comparison. The follow-up email experience extended the product beyond the tool itself, re-engaging users who had started the process but hadn't yet moved forward.
01
02
see also